The Fixed Asset Projected Value Excel report combines posted fixed asset ledger entries with calculated depreciation for a selected depreciation book. It shows a running book value and identifies projected entries. The calculations don't post depreciation to the fixed asset ledger.
Specify First Depreciation Date and Last Depreciation Date for the projection. Posted Entries From controls which actual entries are included, not when depreciation starts. Use Number of Days or Use Accounting Period to set the projection intervals. No. of Days in First Period overrides the days used for the first depreciation calculation.
Select Projected Disposal to limit projections to the asset's projected disposal date when that date falls within the projection period. Inactive assets and assets already disposed of are excluded.
The report Excel workbook includes the following report and data worksheets:
- Projected Value (Print)
- Projected Value (Analysis)
- FixedAssetData
Use the worksheets to analyze data in different ways.
Tip
If you configure OneDrive for system features, the Excel workbook opens in your browser in Excel for the web. Otherwise, the workbook is downloaded to your device.
Note
This report does the calculations when you view it in Excel for the web, or when you download and open it. If a banner displays text about external data connections, you might need to select the Enable content button to load data. Enable content only if you trust the file. The report doesn't connect to any external data sources. Some layouts use Power Query to prepare the analysis worksheets. Depending on your organization's security settings, you might also need to right-click a PivotTable cell in Excel for Windows and select Refresh to update data in the report.
Projected value worksheets
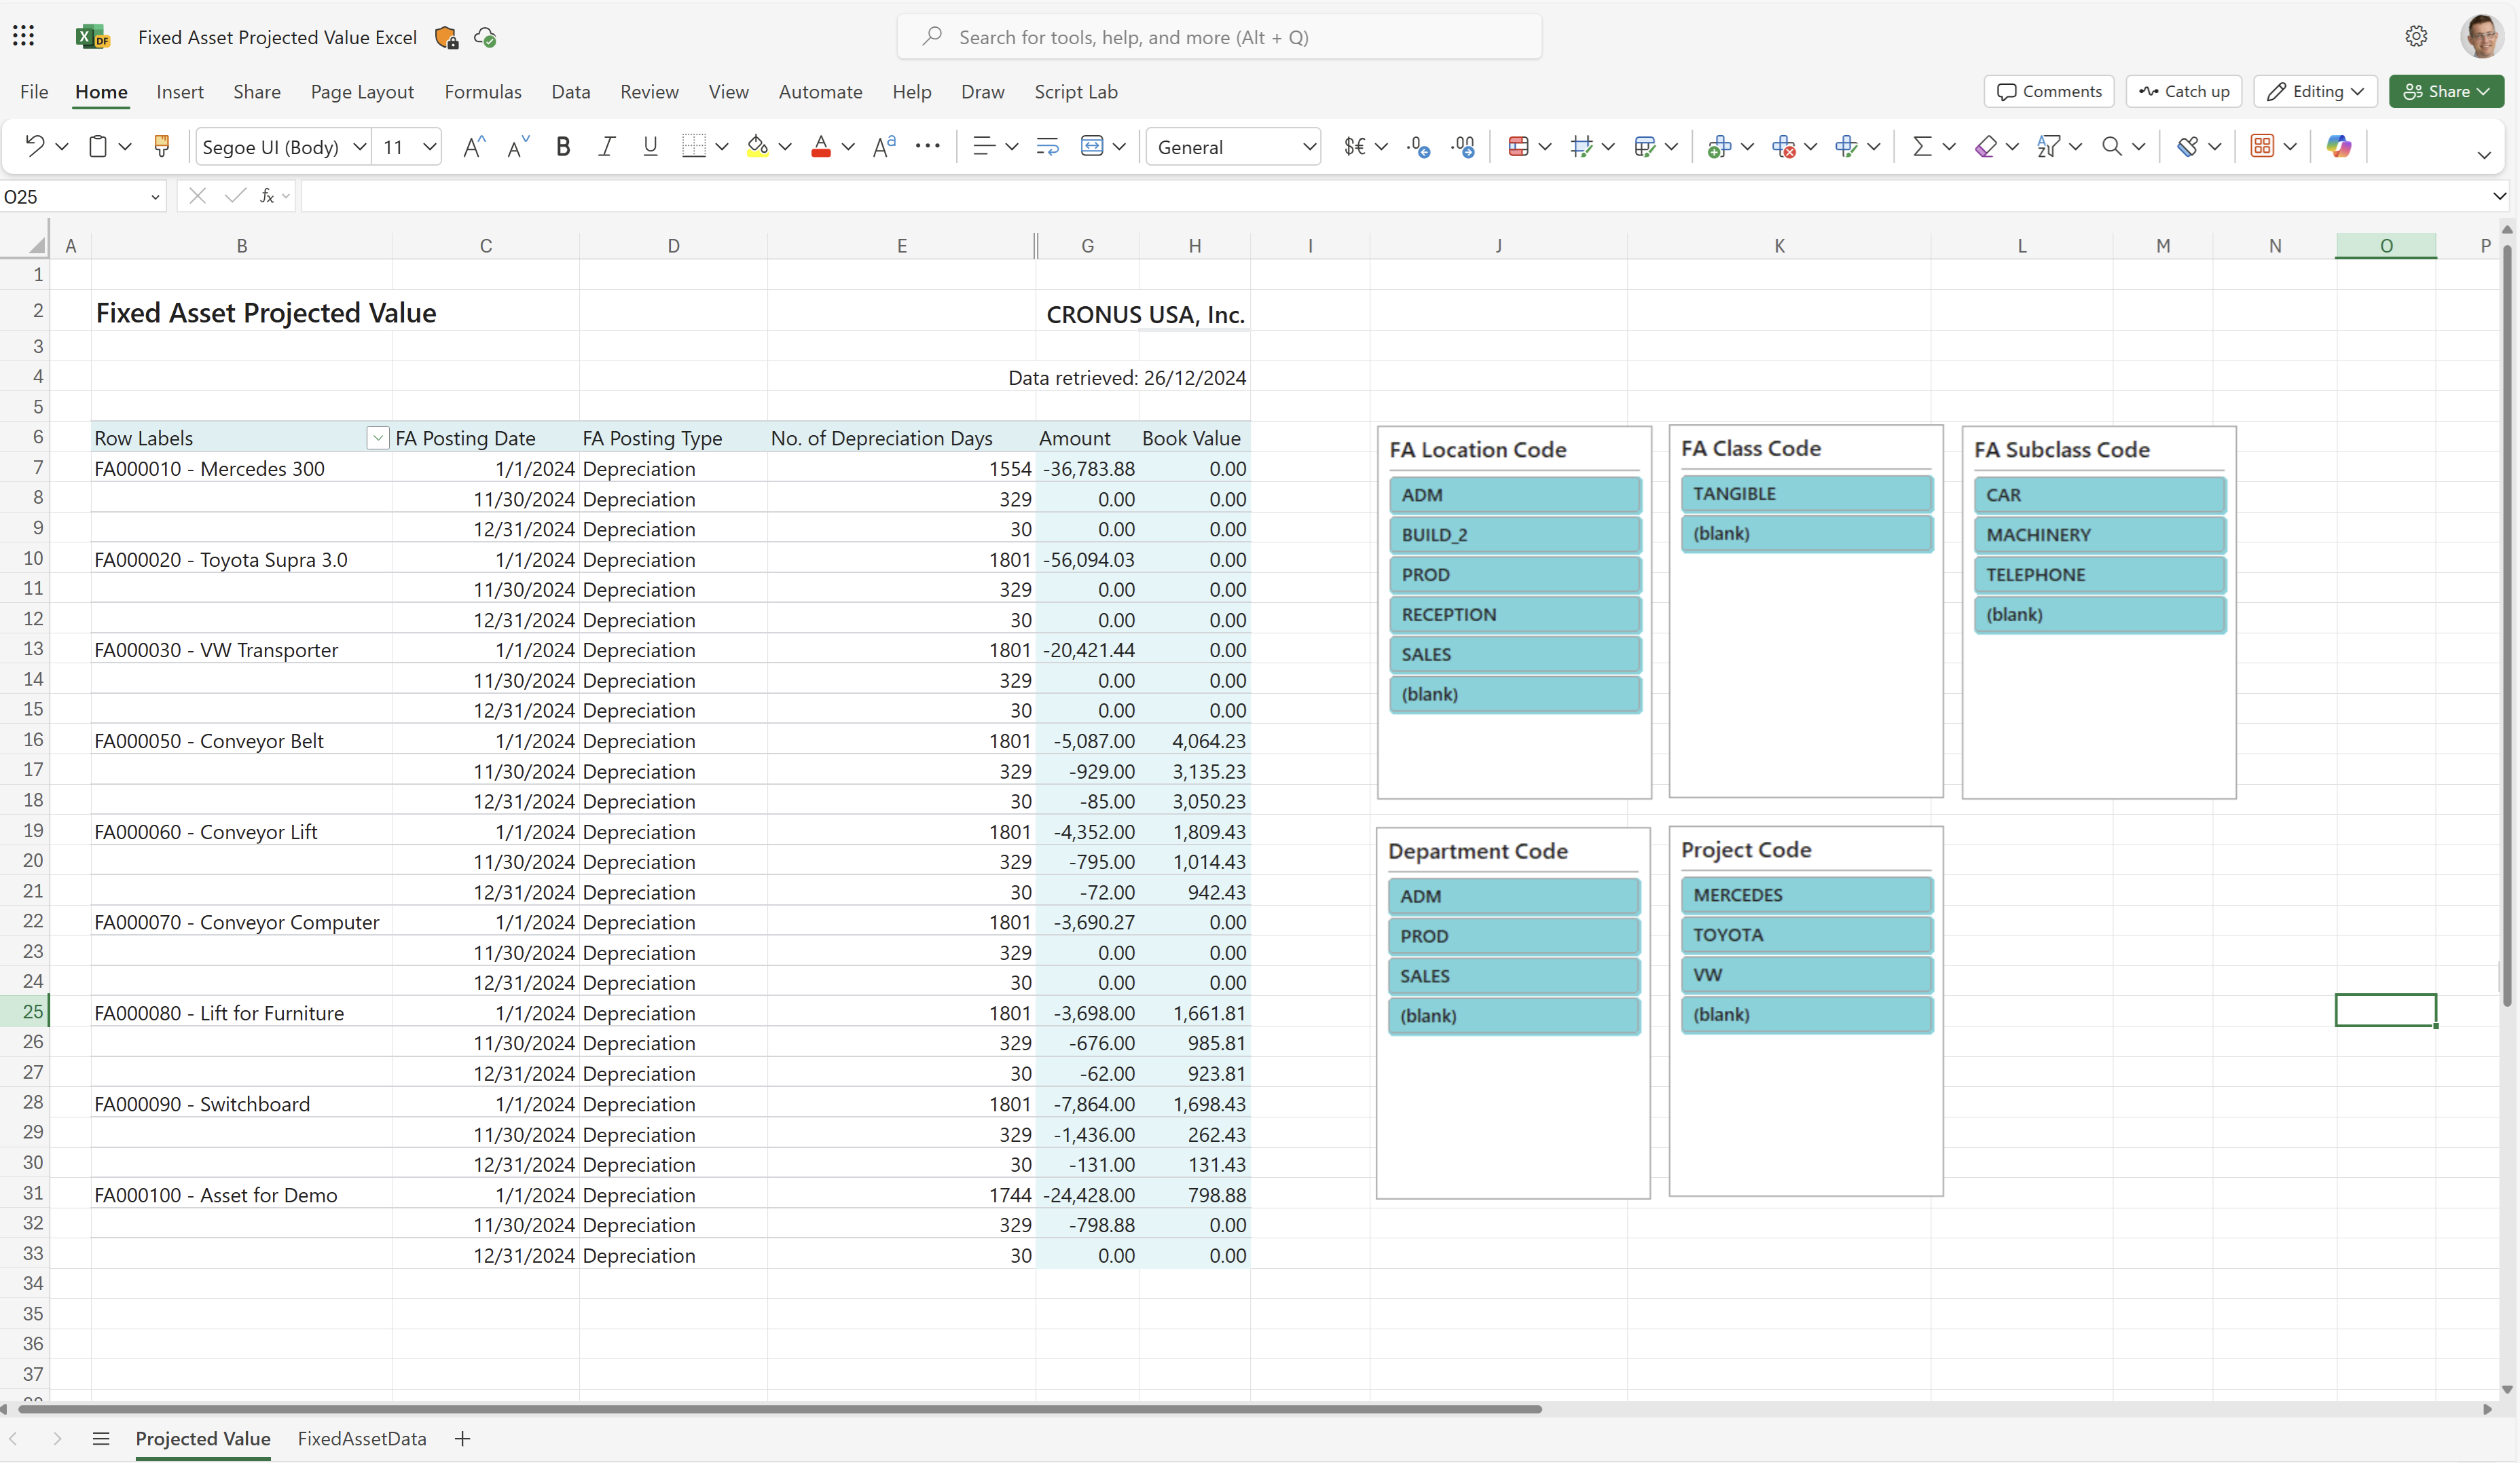
These worksheets show the fixed asset posting date, posting type, number of depreciation days, amount, and book value for the fixed assets and period specified on the report request page.
The filters and slicers on the analysis worksheet let you zoom in on a fixed asset's class, subclass, or location. You can also filter by the two global dimensions. The dimension names depend on your company's setup.
[Screenshot of the Fixed Asset Projected Value worksheet.]
Tip
The data is shown in an Excel PivotTable. Select any cell in the PivotTable to show the Field List, where you can arrange fields. You can also group or ungroup values and filter data in the PivotTable. Learn more in the following articles:
Fixed asset data worksheet
This worksheet shows the raw data used in the report.
Use this worksheet for data analysis assisted by built-in tools in Excel, such as Excel Copilot when it's available to you, or the what-if analysis tools. You can use Forecast Sheet in Excel for Windows if the data includes a date or time series with consistent intervals and corresponding numeric values.
[Screenshot of the FixedAssetData worksheet]
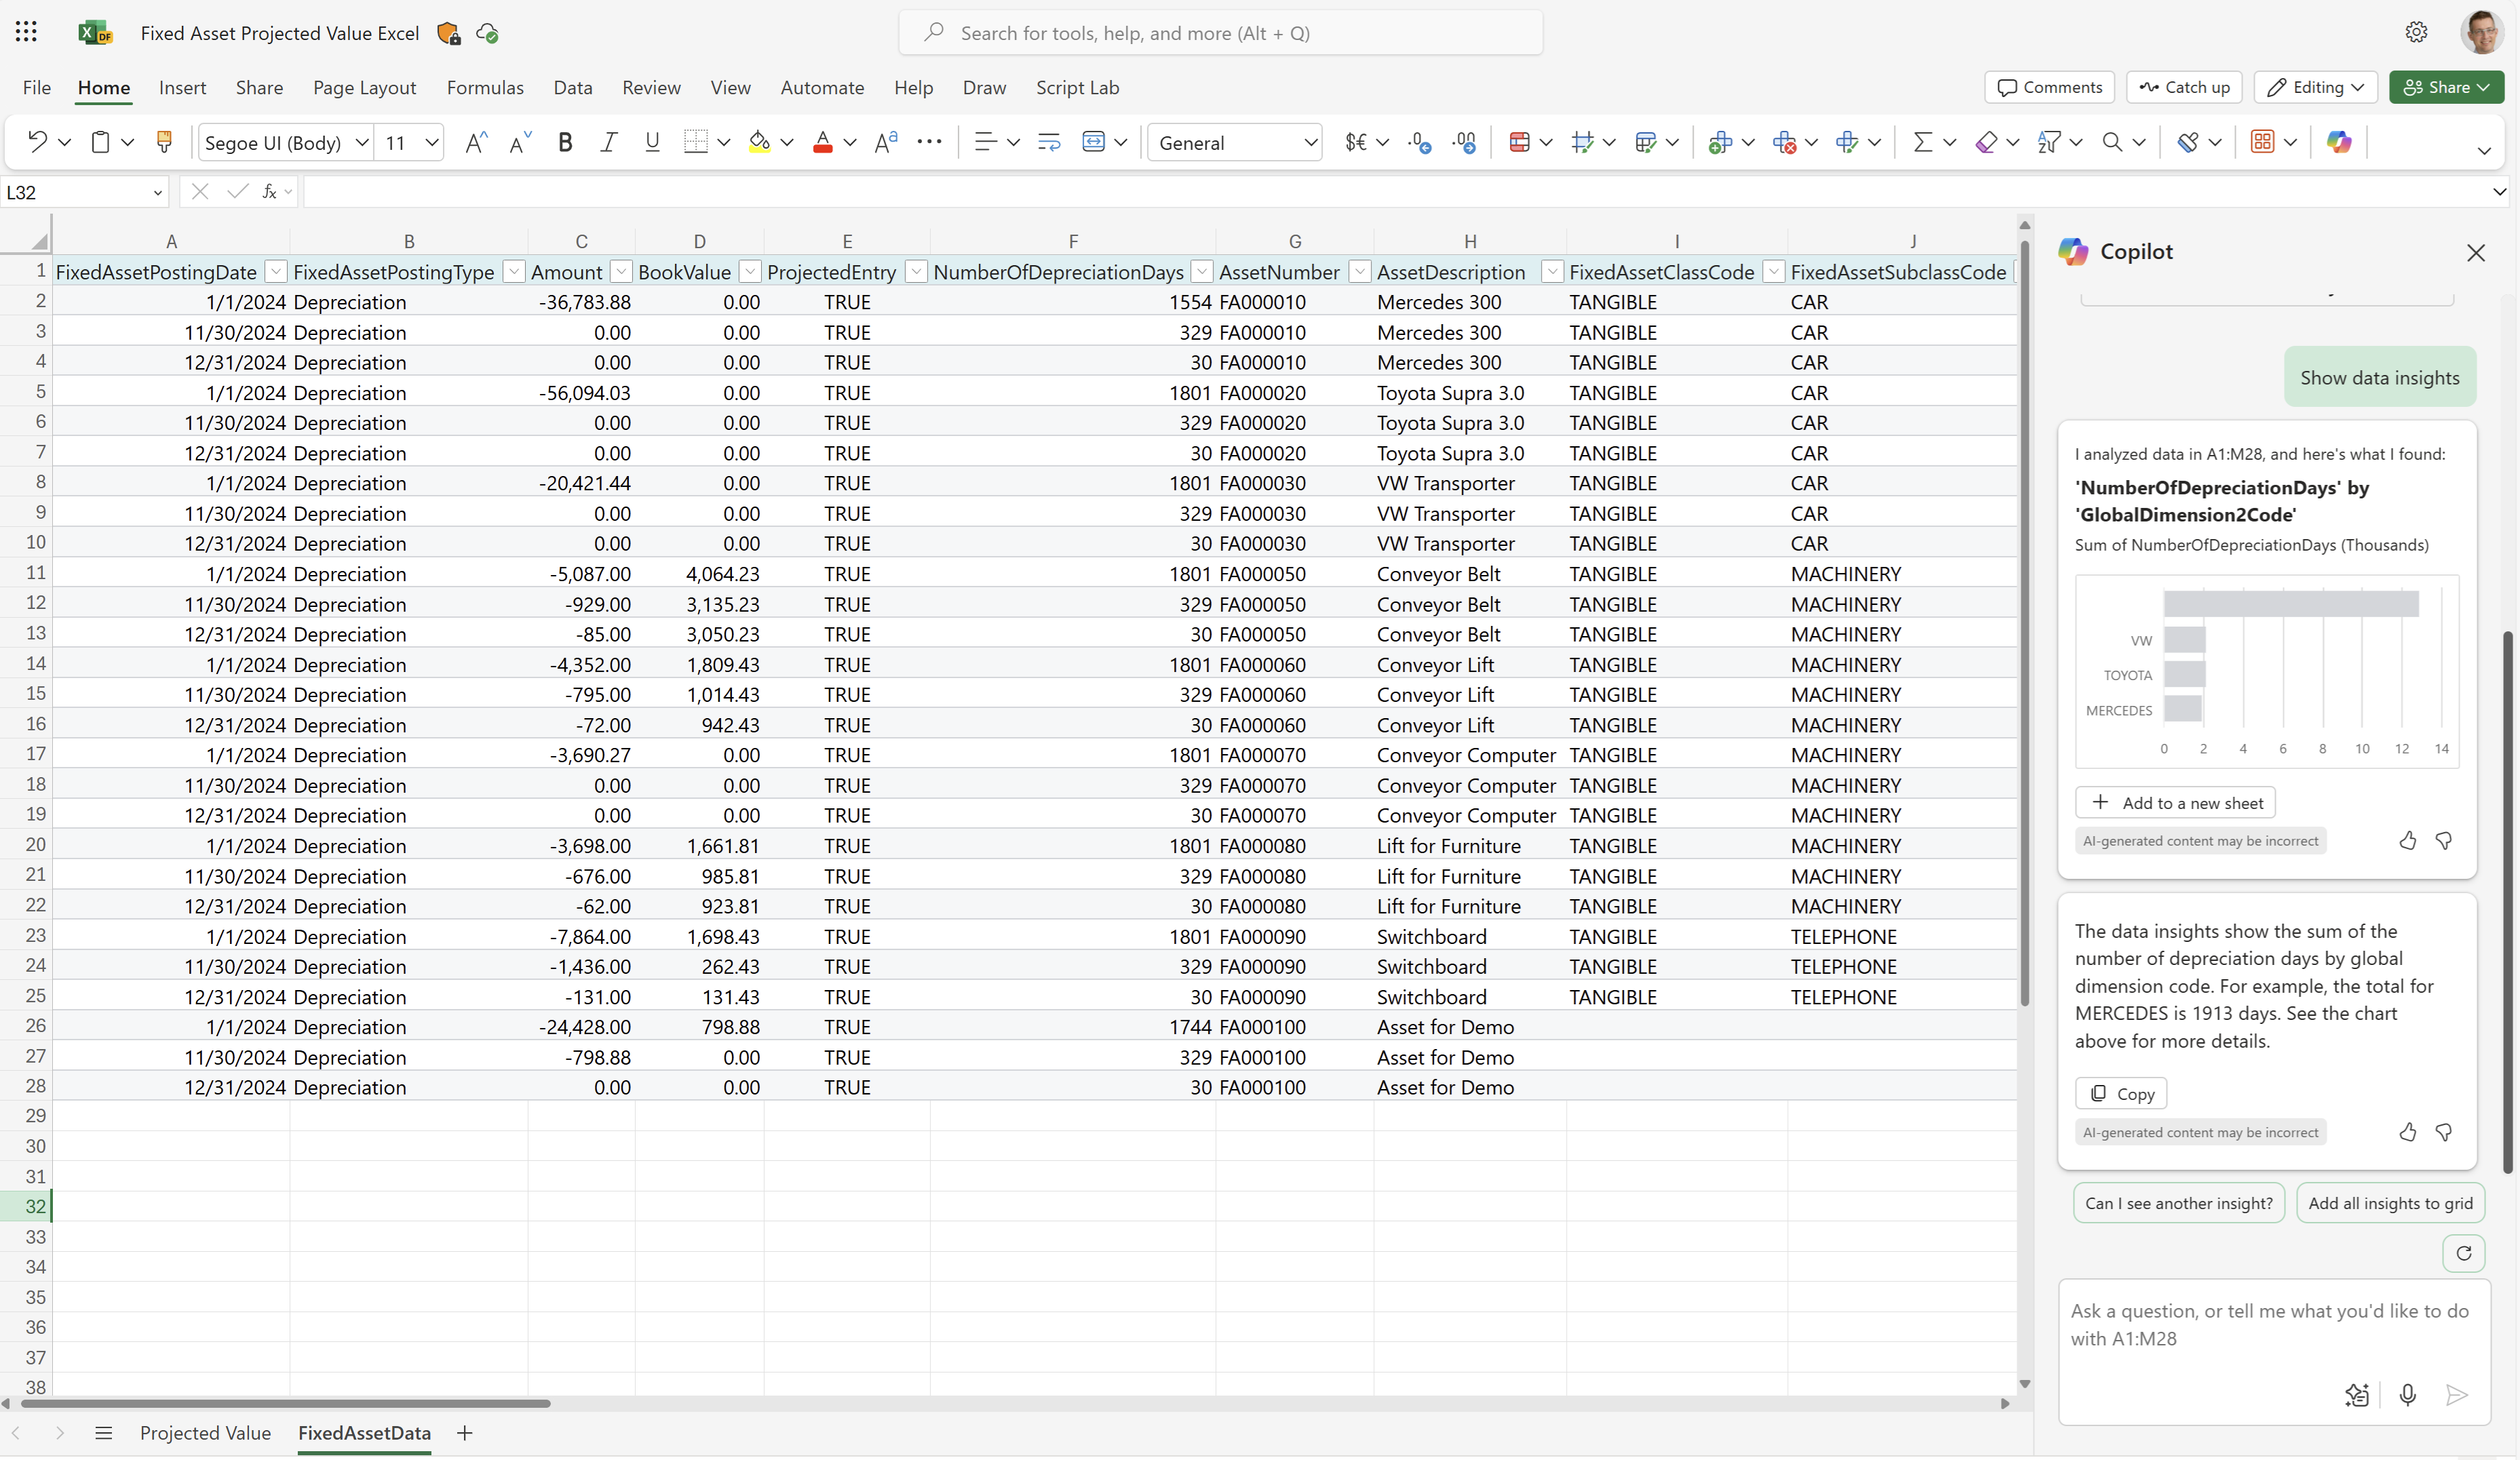
Copilot availability depends on your license and your organization's settings. Learn more in Get started with Copilot in Excel.
Supporting workbook worksheets
The Business Central platform always adds three system worksheets to Excel reports:
- TranslationData, with text needed for multilingual reports.
- CaptionData, with text from Business Central fields needed for multilingual reports.
- Aggregated Metadata, with data about the report, and when and how it was run.
All three worksheets are hidden by default. Learn more in System Excel sheets.
Use cases
Explore projected depreciation amounts and book value for a future period for your fixed assets.
Fixed asset managers use the report to:
- Estimate the amount of accumulated depreciation of your assets at the end of the selected period.
- Plan for the replacement of assets based on their projected book value.
- Determine which assets are due for depreciation and plan for adjustments.
Finance managers use the report to:
- Review and adjust the budgeted depreciation amounts for an upcoming period.
- Analyze the projected book value of assets and determine whether to dispose of assets that aren't needed.
- Forecast the financial performance of an organization based on the projected values of depreciation.
Accountants use the report to:
- Calculate the tax implications of the projected depreciation amounts.
- Review depreciation forecasts by comparing the projected book value of assets with their posted book value.
- Determine whether to adjust financial statements based on the projected values of depreciation.
The report doesn't write amounts to a G/L budget.
Try the report
Try the report here: Fixed Asset Projected Value Excel
Tip
If you hold down the Ctrl key while you select the report link, the report opens on a new browser tab. The new tab lets you stay on the current page while you explore the report on the other browser tab.
Make the report your own
You can create your own report layouts with Excel, either from scratch or based on an existing layout. To modify the layout for the report, export the layout (not the workbook that resulted from running the report) from Business Central, make your changes, and then import the layout into Business Central.
Learn more in Task 1: Create the Excel layout file.
Alternative reports
There are several other ways to analyze your fixed assets. Learn more in the following articles:
Contributors
Microsoft maintains this article. The following contributors provided some or all of its contents.
- Kim Dallefeld | Microsoft MVP
Related information
Ad-hoc analysis of fixed assets data
Fixed assets analytics overview
Financial analytics overview