APPLIES TO: Business Central 2025 release wave 1 and later.
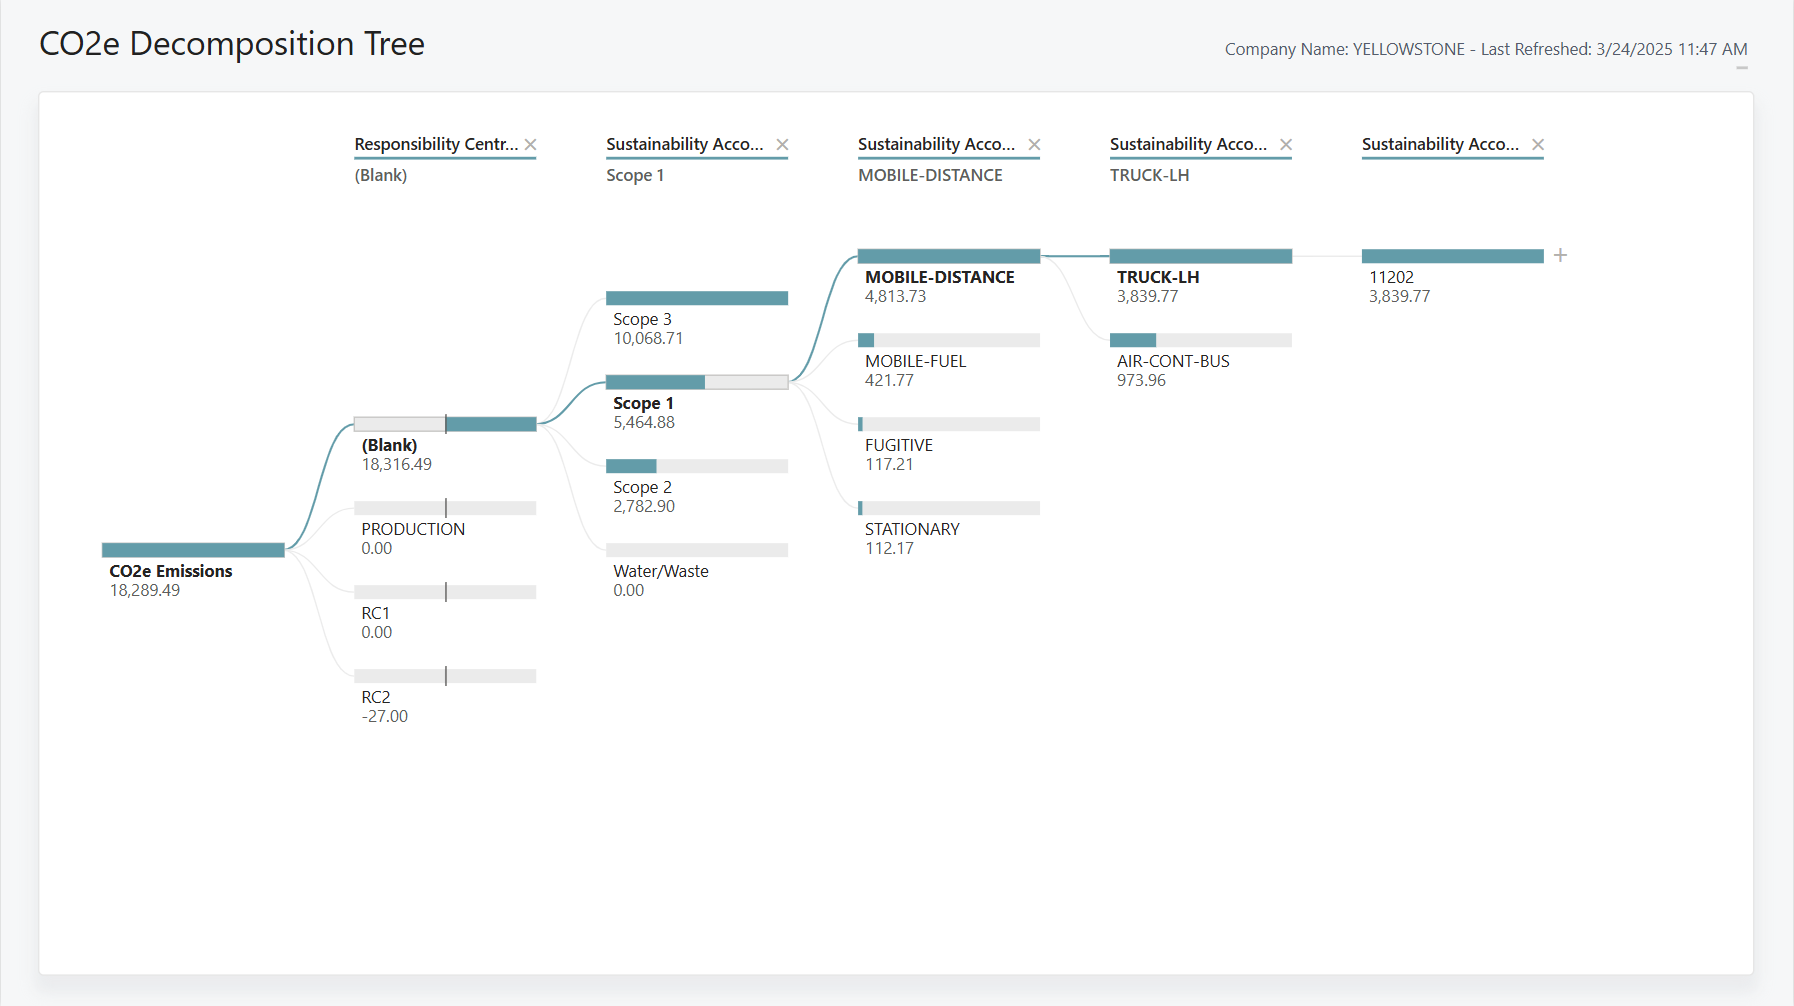
The CO2e Decomposition Tree report breaks down CO2e emissions across multiple factors. The decomposition tree lets you explore dimensions in different orders to identify factors that contribute to your organization's overall emissions. This exploration doesn't change the underlying data.
[Screenshot of the CO2e Decomposition Tree Power BI report]
Use the report
Sustainability Managers use this report to explore CO2e emissions based on multiple factors, so you can focus on areas with the highest effect.
Executives rely on this report to understand the hierarchical breakdown of emissions. The report helps you track progress towards your sustainability goals and make informed decisions to improve the overall ESG of the organization.
Key performance indicators (KPIs)
The Co2e Decomposition Tree report includes the following KPIs and measures:
Choose the link for a KPI to learn more about what it means, its calculation, and what data is used in the calculations.
Tip
You can easily track the KPIs that the Power BI reports display against your business objectives. To learn more, go to Track your business KPIs with Power BI metrics.
Data used in the report
The CO2e Decomposition Tree report uses data from the following tables in Business Central:
- Sustainability Ledger Entry
- Sustainability Account
- Sustainability Account Category
- Sustainability Account Subcategory
- Sustainability Goals
- Responsibility Center
- Emission Fee
- Country/Region
Try the report
Try the report here: CO2e Decomposition Tree
Tip
If you hold down the Ctrl key while you select the report link, the report opens on a new browser tab. The new tab lets you stay on the current page while you explore the report on the other browser tab.
Related information
Sustainability Overview (Power BI Report)
Sustainability management overview
Sustainability reports and analytics in Business Central