APPLIES TO: Business Central 2025 release wave 1 and later.
The Sustainability Power BI app provides detailed insight into an organization's emissions to support environmental, social, and governance (ESG) reporting. The report helps identify key areas to change. The app provides various reports that focus on areas that organizations want to track, such as Water and Waste Analysis, Journey to Net Zero Carbon, and Social Analysis.
Sustainability analytics
To fit into this category, you might have a role such as:
- Sustainability Manager
- Data Analyst
Example scenario: The sustainability team needs to review their water and waste usage over a period
As someone on the Sustainability team, you want to consistently review your water usage and waste generation at specific facilities. Using the Water and Waste Analysis report, you can compare water usage with the configured water capacity at each responsibility center. The available water measure is the capacity for the selected period minus water usage.
[Screenshot of water and waste analysis by location and facility.]

The report also allows the team to track different water and waste types along with the YOY and DOD change to ensure they're moving in the right direction.
Sustainability analytics for the executive team
To fit into this category, you might have a role such as:
- CEO
- Chief Operating Officer
- Chief Sustainability Officer
Example scenario: Ensure targets are being met
For someone on the executive team, you need to ensure targets you put in place for the organization are being met. The Realized Emissions vs. Target report can quickly and efficiently compare your actual emissions with your target and make informed decisions about where to make changes.
[Screenshot of CO2e emissions compared with targets in Power BI.]
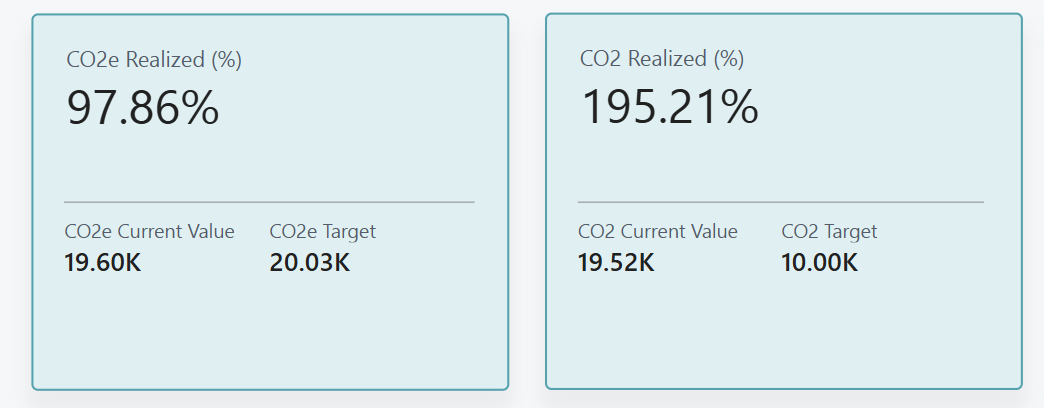
You can compare the data in this report with the Journey to Net Zero Carbon report to ensure your organization is on the right track.
[Screenshot of the Journey to Net Zero Carbon report in Power BI.]

For an executive looking for a quick, high-level view for their organization, you can use the Sustainability Overview report.
Alternative use cases
While the reports benefit these examples, in some scenarios other roles can also use this report pack. For example, a Procurement Manager might use the Emissions by Category and Scope report to review Scope 3 and identify purchase-related emission categories to address. Or, a member of the Human Resources team can use the Social Analysis report to review employee absences, qualifications, and workforce distributions.
Use the reports
The following table provides descriptions on how you can use each report in the Power BI Sustainability app.
| To... | Open in Business Central (CTRL+select) | Learn more |
|---|---|---|
| The Sustainability Overview report gives you a high-level view of all the key sustainability metrics. | Sustainability Overview | About Sustainability Overview |
| The Journey to Net Zero report highlights the journey to net zero within an organization. | Journey to Net Zero Carbon | About Journey to Net Zero Carbon |
| The Realized Emissions vs Target report breaks down your carbon emissions and allows for comparison against the target. You can effectively monitor planned progress and drive continuous improvement to sustainability goals. | Realized Emissions vs Target | About Realized Emissions vs. Target |
| The Realized Emissions vs Baseline report breaks down your carbon emissions and allows for comparison against a defined baseline period. This comparison lets you track progress against the baseline and monitor trends against a previous period. | Realized Emissions vs Baseline | About Realized Emissions vs. Baseline |
| The Water and Waste Analysis report allows you to effectively monitor your water and waste usage by different metrics such as water type, intensity type, and responsibility center. | Water and Waste Analysis | About Water and Waste Analysis |
| The Emissions by Category and Scope report breaks down each emission type based on the account category and the scope to show how each account and scope is tracking. | Emissions by Category and Scope | About Emissions by Category and Scope |
| The CO2e Analysis report provides detailed insight into your CO2e emissions and purchased carbon credits. | CO2e Analysis | About CO2e Analysis |
| The CO2e Key Influences report identifies factors associated with increases or decreases in CO2e emissions, including sustainability account categories. | CO2e Key Influences | About CO2e Key Influences |
| The CO2e Decomposition Tree report breaks down CO2e emission metrics into its key contributing components to help you understand what's driving changes in CO2e emissions, and why. | CO2e Decomposition Tree | About CO2e Decomposition Tree |
| The Social Analysis report displays employee details as part of social reporting for ESG. | Social Analysis | About Social Analysis |
Tip
You can easily track the KPIs that the Power BI reports display against your business objectives. To learn more, go to Track your business KPIs with Power BI metrics.
Related information
Sustainability Overview (Power BI Report)
Sustainability reports and analytics in Business Central
Sustainability scorecards and goals overview